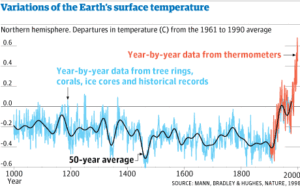
HOCKEY STICK GRAPH USED DATA FROM TREE RINGS AND ICE CORES
The World Meteorology Organisation (WMO) do not measure world temperatures but are able to glean an average global temperature from a number of climate monitoring authorities. According to Phil Jones of CRU East Anglia the earth average temperature for 1998 will turn out to be about 58 degrees or 14.444 C, a full degree warmer than the 1961-1990 average of 57 F and similar to Hockey Stick graph below. 1993 was 15.21 C, 0.21 C above the 1951-1980 average of 15 C. WMO data indicates the global temperature in 1994 was approximately 0.32 C warmer than the 1951-1980 baseline average of 15 C.

This is calculated by comparing 1994’s position on the NASA global temperature anomaly chart to other years, though a specific year-by-year anomaly value is not readily available in a simple search.
WMO’s first climate reports in 1993 and 1994 had used the same average temperature of 15 C (59 F) for the period 1951-1980 baseline reference that NASA had been using since 1900 through to 1994 before it had also switched to what should have been a much warmer baseline period between 1961-1990 of 14 C (57 F) than the 1951-1980 average temperature of 15 C (59 F).
1 Comment
How in hell, in a warming world, could the thirty year period of 1961-1900 be cooler than the 1951-1980 period especially when the former mentioned produced record annual temperatures in the 80’s that still stand today.